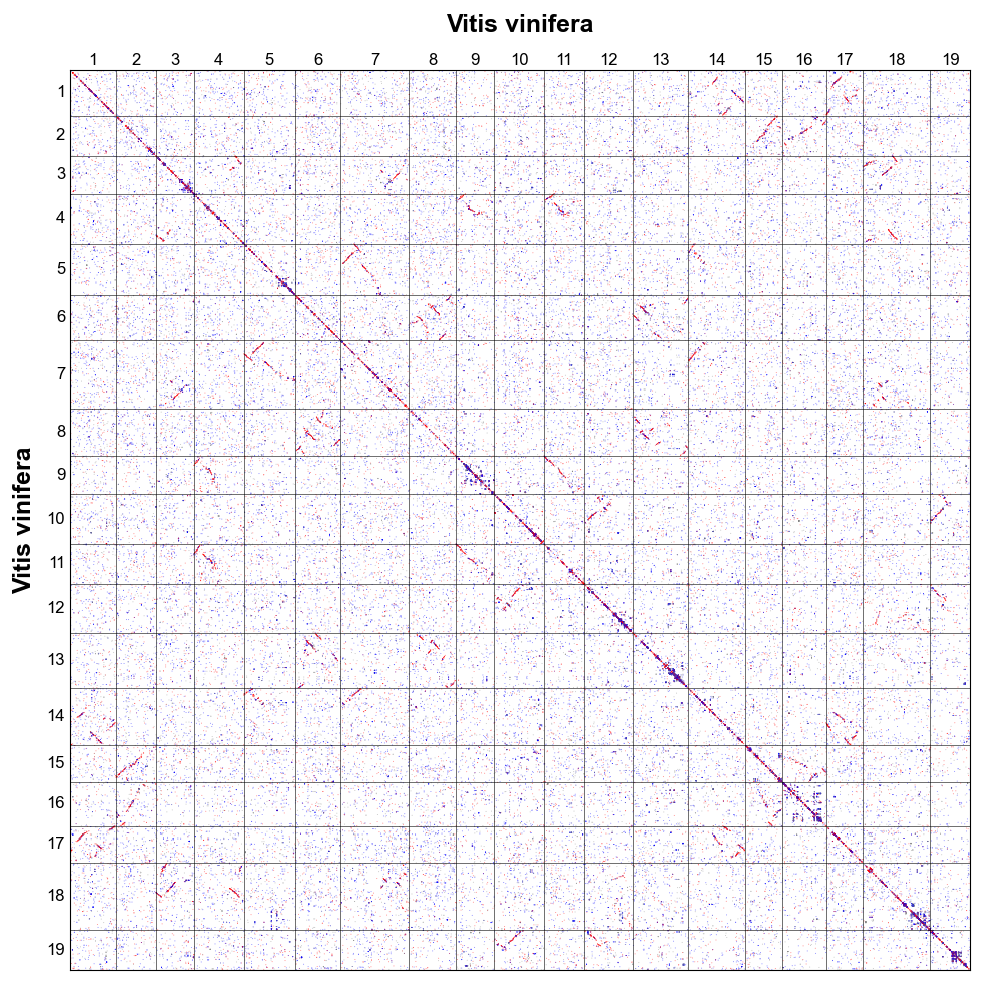
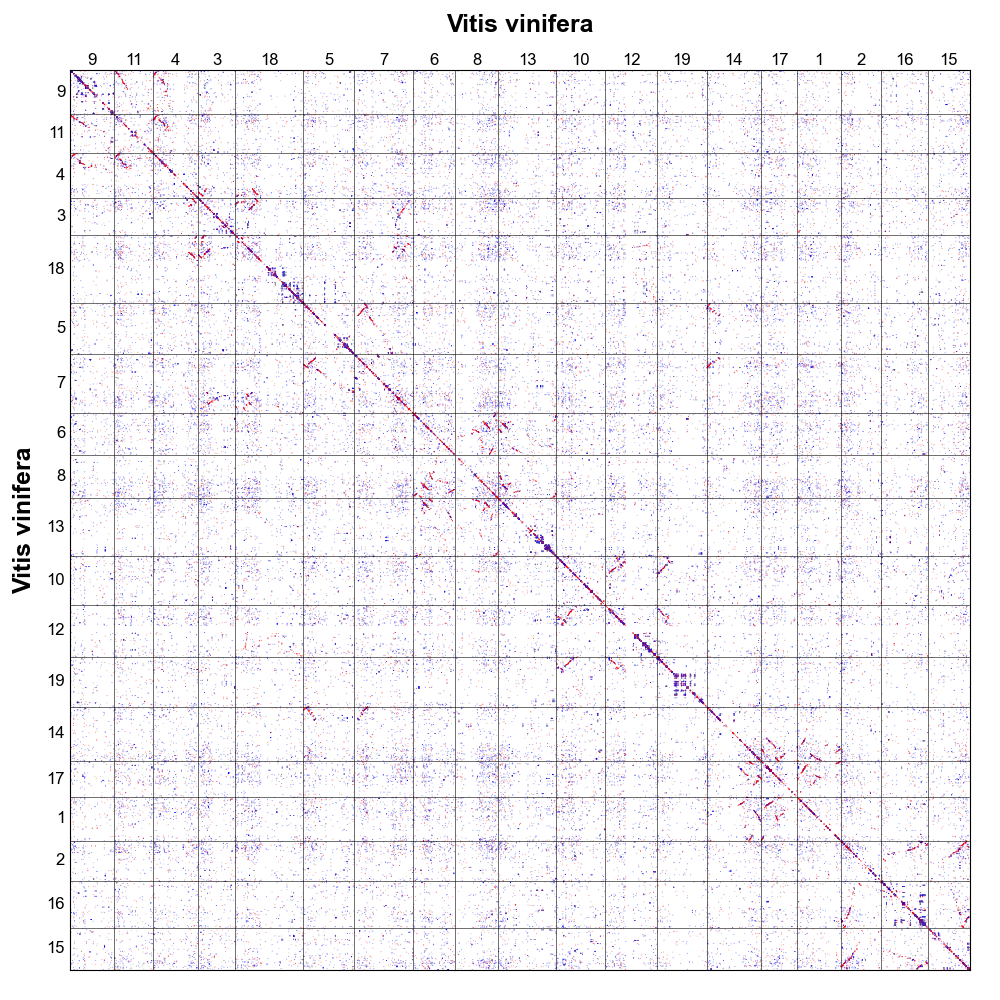
Dotplot
Dotplot shows homologous gene dotplot.
Parameters
Parameters |
Standards and instructions |
blast_reverse |
Type: bool | Default: false The first two columns of the blast result swap positions. |
multiple |
Type: int | Default: 1 The best number of homologous genes shown with red dots. |
score |
Type: int | Default: 100 Score value in blast result. |
evalue |
Type: float | Default: 1e-5 Evalue value in blast result. |
repeat_number |
Type: int | Default: 10 The maximum number of homologous genes is allowed to remove more than part of the population. |
position |
Type: {order, start , end } | Default: order The position of a gene corresponds to the gff file. |
ancestor_left |
Type: file | Default: none The ancestral chromosome region of the species on the left of dotplot. |
ancestor_top |
Type: file | Default: none The ancestral chromosome region of the species on the top of dotplot. |
markersize |
Type: float | Default: 0.5 The size of the point in the plot. |
figsize |
Type: int,int | Default: 10,10 Control the proportion of the size of the saved picture. |
savefig |
Type: {*. png,*. pdf, *. svg} | Default: *. png Save pictures support png, pdf, svg formats. |
Use command to enter the folder wgdi -d help >> total.conf Take out the parameter file.
[dotplot]
blast = blast file
blast_reverse = false
gff1 =  gff1 file
gff2 =  gff2 file
lens1 = lens1 file
lens2 = lens2 file
genome1_name =  Genome1 name
genome2_name =  Genome2 name
multiple  = 1
score = 100
evalue = 1e-5
repeat_number = 10
position = order
ancestor_left = none
ancestor_top = none
markersize = 0.5
figsize = 10,10
savefig = savefile(.png,.pdf)
Quick start
After the parameters are modified properly, then run wgdi -d total.conf
Example
The original results are easily accessible at wgdi-example